Sunday, September 29, 2019

What Can Field of Dreams Teach Us About Corn and Trading Macro?

Last night I wasted Field of Dreams with the kids. Plenty of complaints before the start. One wanted to watch Avengers, another didn’t want to watch a sports movie. The other one was opposed to the entire endeavor. 


They came around pretty quick. But here was my big takeaway: I’m on the verge of becoming a naturalized citizen in the commodity world--I couldn’t stop thinking about how all the farmers were appalled and outraged when Kevin Costner dug up his corn to build the baseball field. And then there was the clearly disastrous financial implications, where this decision put his farm on the verge of bankruptcy. 

I had questions. 1) how much corn did he dig up? 2) how much revenue did he forego, in absolute terms and relative to the size of the farm? 3) Given a few assumptions, was this really a farm-wrecking decision, or was this Hollywood stuff? 

In 1987 many farms in Iowa were between 250-500 acres, and this same data shows a husband/wife team could have eked out a living managing such farm. Let's assume this was a 250 acre farm.

The average value per acre in Iowa was $875 in 1987, around the depth of the US farm crisis. A 250-acre farm could have been had for around $220,000. Lets call it $280k with a modest farm house on the property. Putting say, $60k down on such a property was certainly within reach for a college educated, dual income couple in their mid-30s that has been working and saving for 10-15 years.

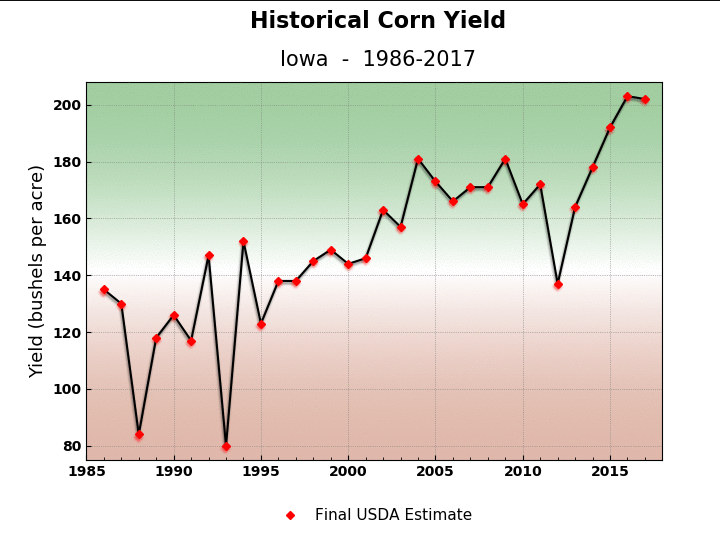
So 250 acres of corn, yielding 120 bushels nets you 30,000 bushels of corn. Lets say Kevin Costner is a particularly crafty basis trader and he gets $2/bushel for his corn. He grosses $60,000.  The 1987 census report above suggests such a farm might generate $20-$30k in net income--enough to live on if you’re into the lifestyle--but there were many farms during that time that were losing money.  Bankruptcy was certainly on the mind of every US farmer in the mid-late 80s. 

Now, what about this baseball field? A major league baseball field is around 2.5 acres. 


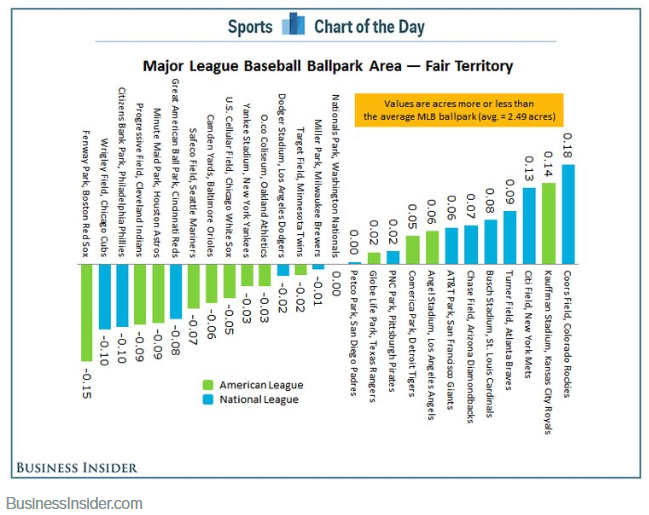
But with foul territory and some residual space for bleachers, you’re probably looking at another acre. But no more than 4.5 acres total, even if you add in a few parking spaces. 

Let's say Kevin Costner dug up four acres of corn. That’s less than $1000 in foregone revenue in the year he dug it up (it probably had some residual silage value!) and in the new crop year when Shoeless Joe finally showed up. 

So our hero gave up $1000 out of $60,000 in revenue, and maybe $30,000 in net income. Let’s add on another $1000 for the infield dirt, the grass he planted, and the backstop fence.  Despite the gossiping and murmuring of the other farmers and their wives, he certainly could have billed it as a community service--and heck, even written it off on his taxes--since presumably he didn’t just let the field sit there..he let the local farm-kid teams play on it while he was waiting for whatever was supposed to happen. 

An aggressive financial decision, but one easily justified by hearing a voice say, “If you build it, he will come.” 

Kevin Costner made one crazy, totally unjustifiable decision: he lit the field!! 


This, is what would have bankrupted his farm. This is the decision that would have had his smarmy brother-in-law questioning his sanity.  Lighting the field today would easily get you into six digits, and would certainly have been out of reach for a financially strapped family farmer in the midst of an agricultural crisis.

Sure, it made for the coolest scene in the movie. 
But completely implausible.  

Here’s a few light-hearted takeaways for market analysis: 

Question assumptions. We all have a cognitive bias to buy into what we’re being told. It’s called “Truth Default Theory”. It’s what makes movies work….but it often turns into a trap in markets. 

Sometimes the trade is not where you think. Everyone jumped on Kevin Costner for digging up his corn--but it was the lights that were financially reckless. 

Everyone loves a story.  Many trades are long on “story” because stories sell. You’re not going to get your boss to buy into upsizing your trade because of your spreadsheet. You need a story.

But….every story needs data.  Stories without data are just that, Hollywood stories. A good story combined with solid data can go a long way. 

But most important:
Be open to changing your mind.  I didn’t mention this above, but the key point of the movie is when the fussy pants brother-in-law has his epiphany. This was a man that was deep into his own trade to buy Kevin’s farm. But he changed his mind. That this was done only with divine intervention is irrelevant! Too often we get wedded to ideas and refuse to accept the metal cost of accepting that we were wrong and changing course. 

Love your ideas, but don’t be afraid to set them free. 

Monday, September 2, 2019

Curve Flattening and Monetary Policy Effectiveness: Is This Time Different?


No doubt you’ve read something about the flattening of the yield curve. You may have even heard it inverted. I can always tell when an arcane financial concepts hit the mainstream by when my relatives ask me about it.  I’ve gotten that one a few times lately. 


But let's take that question at face value. Let’s put aside curve inversion for a moment.  What does a *flattening* yield curve mean for monetary policy and the economy? 


Mohamed got me thinking about that question this afternoon: 


The biggest story in financial markets over the past year is not the inversion of the US yield curve, but the bull flattening of the bund curve: here is a chart of Germany 5y/30y slope vs. assets on the ECB balance sheet:  


The end of the ECB’s asset purchase program coincided quite closely with a slowdown in global growth that resulted in the bull flattening of the 5y/30y bund curve. What does that mean? Slowing growth--but also little optimism for a pickup in growth or inflation in the future. Combine that with the factors Mohamed mentioned and you have the recipe for a very big bull flattening. 


Fast forward to the next ECB meeting. How should monetary policy react? Traditionally, as growth slows monetary policy eases, either through rate cuts, or more recently, asset purchases. You can see that clearly in the chart above in 2015 and heck, right through to 2017. 


The flattening in 2014 and again in 2016 both reversed out quite nicely--the first time the result of increased QE from the ECB, and the second time after global growth recovered from the nadir of China growth fears and low oil prices in early 2016. 


Where does that leave the ECB today? In a heap of trouble. They need to steepen the curve. 


Among the myriad problems in Europe are their banks. The flat curves, low growth, and regulatory constraints have strangled big European banks. Look at this chart of return on equity in European banks vs. US banks: 
Sources: Bloomberg, Federal Reserve Bank of St. Louis (FRED)

A flat curve means that banks can’t borrow low (from depositors) and lend high (to borrowers). They have to rely on credit spreads or simply do nothing at all and make money off fees. When banks can’t make money on lending, credit growth suffers. A similar chart of US vs. European credit growth would show a similar dissonance between the US and Europe. 


The ECB must find a way to steepen yield curves. How can they do it? Easing monetary policy *must* be a signal for higher growth and inflation, otherwise it is ineffective and most likely counterproductive. If the ECB believes further easing won’t steepen yield curves, they should say so explicitly and tell the government this is their problem now. 


That would lead to an easing of fiscal policy--via issuing more long end bonds. That would give  Mohamed the supply he so desperately wants for his friends at Allianz. 


Now, let's contrast the situation in Europe with what we see in the US.

By way of example, look what happened back in 2007: when the Fed started cutting rates, the 5/30y UST spread started to steepen--as one would expect if monetary stimulus coinciding with the end of the business cycle leads to higher growth in the future (the vertical line coincides with the first cut from the Fed). 


Throughout 2008, the curve stayed steep...going over 200bps in mid 2009. The first round of QE 
Steepened the curve even more: 5y/30y spread topped out at over 250bps in 2010. 


That was very supportive for credit growth--which is one of monetary policy’s core transmission mechanisms. 


Now, looking at the situation today: here is the same chart, 5y/30y ust spread and the fed funds rate.

This time, the curve FLATTENED when the Fed started cutting rates. 


The market is telling the fed and the ECB that they don’t believe the traditional monetary policy transmission mechanisms work anymore. 


Do you believe the market has that right? The market opportunity is clear---bet on further flattening and stagnation if monetary policy is broken--bet on steepening if you think a combination of normal business cycle re-ignition and Fed and ECB easing can sort this out and  return growth to trend. 


My take: I think the market has gotten way out ahead of itself and is trading on 1) fear and 2) momentum. Real money guys benchmarked to indexes--who happen to be getting eaten alive by passive indexation--caught on to the rally in the front end, but have reacted by buying long end duration and convexity. They are going to stay long until proven otherwise. Nobody wants to be left behind in the great bond rally of 2019. 

Now, put on your behavioral finance hat. If you have skin in the game, ask yourself or your colleagues these types of questions:
  • What is the probability the US and/or European governments pass fiscal stimulus packages of at least 2%/GDP per annum? 
  • What is the probability that US and European monetary policy will prove ineffective over the next year--as demonstrated by a 5/30y curves in US and Germany flatter 1 year from now vs. where they are today? 
  • How much of this is Soros-esque reflexivity, reflecting the “fear of fear itself” and a self-fulfilling prophecy of lower long-term interest rates? If you buy into that--what evidence can you bring to the table? 
  • Curves have re-steepened in the past--prove to me why this time is different.


These are the type of questions that can get us past rank speculation and productive discussions about what is baked into the markets and how we can exploit that to generate alpha.

skewrisk@gmail.com
@EMinflationista

Thursday, August 29, 2019

Welcome To Skew Risk! First Post: The Argentina Siren Song


I’m back! After an extended leave of absence I’ve decided to start writing again. 

Let’s start with a story familiar to those that read MM in my first term: Argentina. 


That cute little fella at the top of the page is already back, only a few short years after Macri’s victory put an end to the sordid story of Argentina’s last debt default in 2001.  


I’m not going to get into the economics or the various mistakes made by the current government and the IMF. 

Take a step back and think about how we got here, and the investor psychology required to move headlong back into Argentine debt: 
  • October 2015: Mauricio Macri defeats the ruling party-backed Daniel Scioli, putting a non-Peronist government back in power for the first time in a really long time. 
  • Macri appoints one of the most technocratic governments in the history of emerging markets. Argentine economists up and down the tri-state area that had sought refuge on Wall Street over the past 15 years came home to work for and support the new government. 
  • This new economic team quickly implements a series of orthodox policies and pitches a market friendly reform agenda with the goal of kick starting investment and growth. 
  • Macri quickly negotiates an agreement with holdouts from the previous debt default, and issues a ton of bonds to pay them off and fund massive twin deficits 
  • Investors rejoice and welcome Argentina back into the loving embrace of EM

None of these really look like mistakes, do they? 

It started off well. The new bonds did well enough that the government was able to issue the famous Argentina century bond in June 2017. Later that year the government won important midterm elections that were seen as an important barometer for Macri’s success, political capital and chances of winning re-election. 

Less than two years later, this is the chart on the Argentina 2021 bond...which traded at 110 in Q3-17:

Those arrows are supposed to end in a skull and crossbones. 
There, you get the idea. That’s what they call a “sudden stop” in emerging markets. That influx of foreign capital has gone to money heaven. It doesn’t come back...the next one to bring capital to Argentina is that bird--which is why we’re already at this stage: 


You can cite a few reasons for the descent from ten points over par to recovery value in less than 24 months. The government failed to deliver on growth, didn’t get pension reform done, there was a drought, low soybean prices, crappy growth in Brazil, USD strength, global manufacturing slowdown, you name it. Sure, maybe a confluence of all those things. 

But let's look back at the initial bullet points. Where did Macri go wrong? 

I’d argue it was in the hiring of a ton of technocrats to run the economic program. 

One can imagine how the conversations went. We’ll pay off Elliott. We’ll float the peso. We’ll institute inflation targeting at the central bank. Investors will love it. They’ll come to us in droves. 

Yep, that’s how it went down. These guys played a siren song for EM investors, and they ate it up. They played every tune that is music to their ears….abolish capital controls, reform, inflation targeting, de-regulation, tax cuts...liquidity….oh yeah baby…

Before you know it, by mid-2018 there is $100bn in debt on the books and the fundamentals are deteriorating. Suddenly the IMF is back in town, an organization that has a favorability rating in Argentina on par with Trump on your average university campus. 

 By 2019 the IMF has stabilized the situation well enough to buy Macri some time ahead of the October election. The economy wheezes along. Do investors take advantage of the opportunity to scale out of Argentine debt, given the poisonous political nature of the government’s economic record--and one that got into bed with the IMF? 

No, instead foreign investors ate it up! This is a list of the top ten holders of the Argentina 2021: 

Same chart for the argentina 2028 (the only one that is reducing is blackrock, and only because they updated their data already): 

Real money was not only holding these bonds, they were buying more. They were convinced Macri was going to win and make them a fortune. Take a look at the country weights of some of these mutual funds: you’ll find one after another is, or was anyway...overweight Argentina. 

They bought into the swan song that the government told them. They succumbed to one of the classic behavioral biases: affinity bias. “These guys are just like us! They say they’ll win the election. We can trust them.”

There is also some confirmation bias there--where investors believed the orthodox path the government had taken was going to work. Why? Because that’s what they taught us in school! And the election?? Well, those Argentines….they know better than to bring the Kirchners back in, right? 

And there is the last big mistake. Can you name one technocratic, dare I say, elitist, candidate that has won an election lately? One might say Macron...but look how that’s turned out. Sank without a trace. 

Yet despite a terrible economic record, a leg shackled to a hated foreign organization and a global trend against orthodox, technocratic politics, foreign investors convinced themselves that Macri was going to win. 

Right until he lost big. 

And that brings us back to what Argentina can teach us about the rest of the world. Where else are investors buying into the swan song? 

  • Brazil: sing it to me Captain...pension reform….deregulation….but growth still sucks and the government is still drowning in debt and red tape
  • Italy: wait, it is POSITIVE the most popular politician in the country just got heaved out of the government? That is going to make him LESS popular? 
  • UK: Maybe Boris can pull it off. Or maybe people still believe he can. 
  • United States: I can think of one good scenario going into the 2020 election, but it involves Joe Biden. With the S&P 4% off the highs, investors believe the most beautiful song is still sung by US multinationals. 

This was a big land mine for foreign investors. They stepped on it--not just because they got the story wrong--which happens to everyone. But because they had a few behavioral blind spots that we can all learn from.

Sunday, March 17, 2019

Jered Dillian's Brilliant Article on the Intersection of Risk Management and Personal Finance

Jered crushes it here--invest based on *your* parameters for risk, not someone else's. 

Think about how this applies to your risk management decisions. Are you making risk management decisions based on what your traders' risk tolerance *should* be, or what it really is?

Figuring out what that risk tolerance really is doesn't come out of a model or a corporate budget. It requires time and more than a few conversations.

https://www.bloomberg.com/opinion/articles/2019-03-01/the-key-to-investing-success-is-less-stress


This is a test post

Test post